.svg)
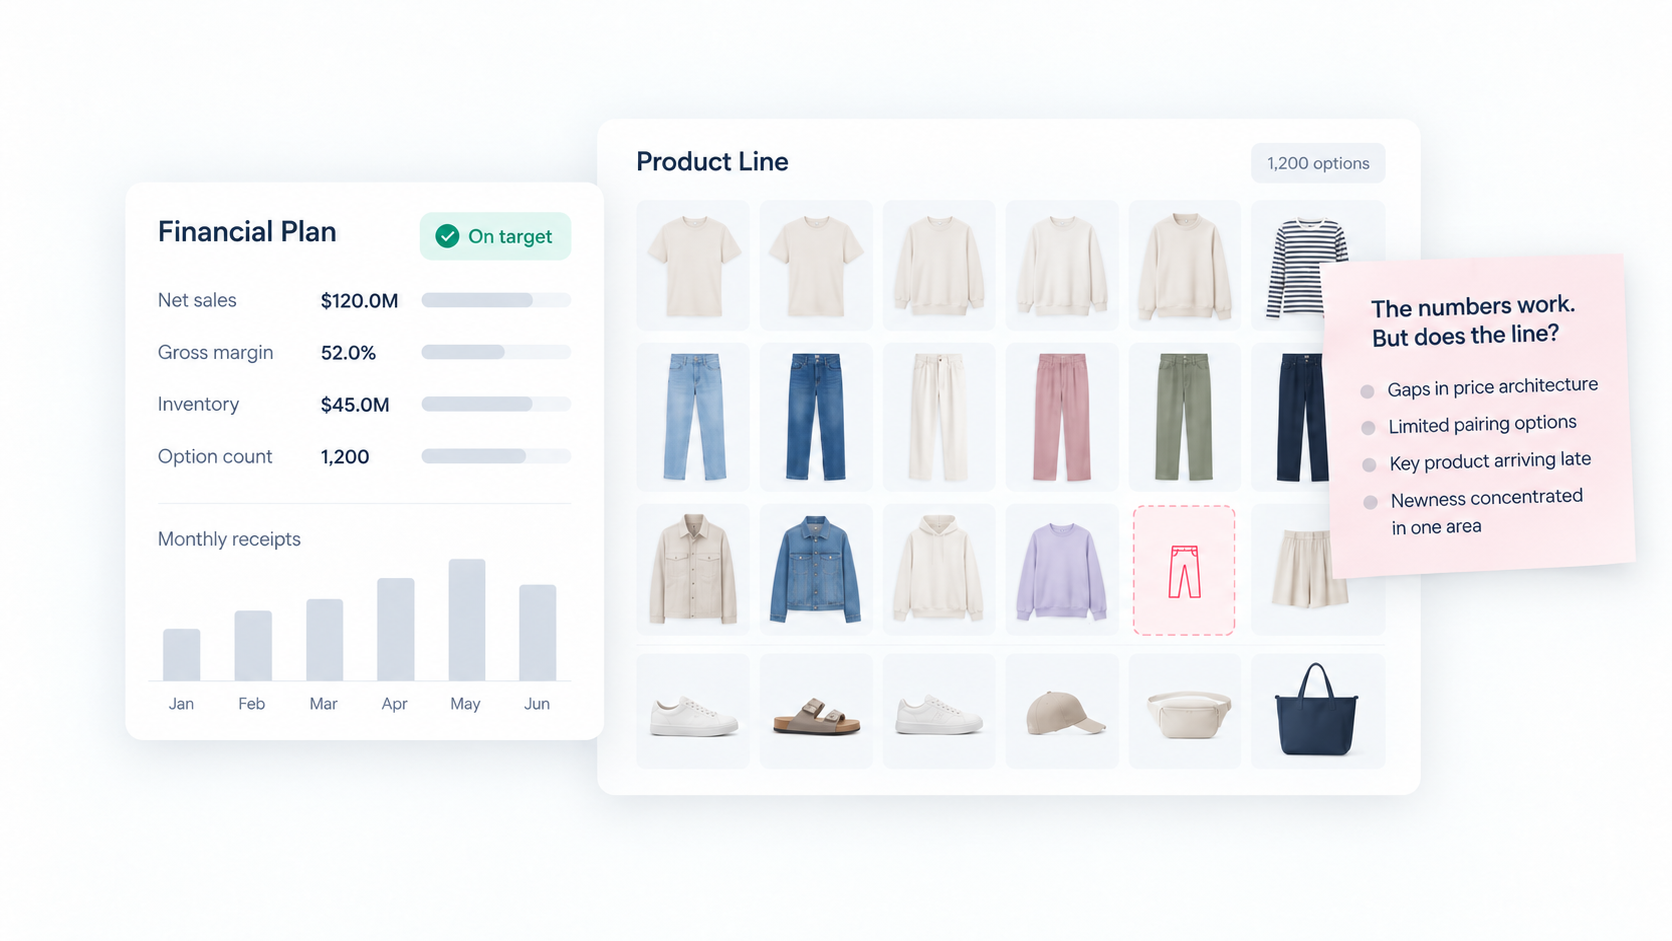
A preseason merchandise financial plan can reconcile to every approved target while the product line still misses the customer. The numbers establish what the business needs to achieve. They do not, by themselves, establish whether the products offer the right breadth, coverage, pairing and newness.
Picture a line review. Sales, margin and inventory tie. Option counts are on target. Then someone lays out the products: several tops serve almost the same occasion, the opening-price denim is missing, and the bottoms intended to complete the collection arrive six weeks late.
Nothing in the arithmetic has changed. The reasons to believe the sales forecast have.
For a head of planning, that is the issue to resolve before the buy: how much of the financial plan is supported by the actual line, and how much still rests on assumptions attached to product slots?
What merchandise financial planning proves
There are three meanings of a “right” plan. It can be mathematically consistent, with inventory flows and margin calculations that reconcile. It can align to leadership’s targets. Or it can be a credible forecast of how customers will respond to the specific assortment.
The first two establish financial discipline. The third requires product and customer evidence. A reconciled plan can still depend on optimistic assumptions about products that are changing or have not yet been selected.
Imagine two lines with 100 style-colour options, assigned the same planned units, AUR, margin and inventory investment. One covers distinct customer needs. The other concentrates its options in similar casual styles and leaves an important price point empty. Both can satisfy the totals. Their sales assumptions deserve different levels of confidence.
Here, “right” means reconciled and aligned to preseason targets. It does not mean the season has already delivered its financial results.
How to evaluate product line quality
The line needs its own review, conducted against the intended customer. Counts and percentages help, but the products behind them need to justify their place.
| The measure | The product line question |
|---|---|
| Option count | How many meaningfully different choices do the options provide? |
| Category and price mix | Are the intended occasions, fits and price points covered? |
| Newness percentage | Is the line fresh where this customer wants a reason to buy again? |
| Receipt flow | Will the products needed for each launch arrive together? |
Price architecture is a useful example. Average unit retail, or AUR, is weighted by the planned unit mix; it is not a simple average of ticket prices. Different price ladders and promotional assumptions can produce the same planned AUR. Meeting that average does not prove there is a credible opening-price offer.
Pairing also needs attention when outfitting is part of the proposition. A jacket can earn its place individually and still have few compatible products in its delivery window. Visual review helps expose that problem. Customer feedback and basket behaviour can help test its commercial importance.
Newness needs a more specific explanation than a percentage. A colour refresh, a new silhouette and an unfamiliar category carry different demand assumptions. Where that newness sits matters, too. A line can meet its overall target while giving returning customers little reason to buy in the category they know best. Protecting core products and introducing fresh choices are decisions to make together.
Coverage should be deliberate, rather than exhaustive. Every additional option absorbs inventory and development capacity. A gap can be a sound decision; it becomes a problem when the forecast assumes demand from customers the line does not serve.
Historical sales reflect the assortment you offered
Sales history records purchases from the products available. It does not capture every customer’s first choice.
A shopper wants a shirt in her size, finds it unavailable and buys another style. The substitute gets the sale. Another shopper leaves. A product that was never ranged generates no transaction history at all.
Research on dynamic consumer substitution models how demand for one item changes when another is unavailable. For planners, the practical implication is to interpret rate of sale alongside availability and the alternatives offered. Historical sales remain valuable evidence. They cannot settle every question about an untested line.
What lululemon and Urban Outfitters found
In Q2 fiscal 2024, lululemon reported gross margin of 59.6%, up 80 basis points, and inventory down 14% year on year. Americas comparable sales nevertheless fell 3%. On the August 29, 2024 call, management attributed weakness in women’s conversion to reduced seasonal newness in colour, print and silhouettes, following earlier product decisions.
URBN’s Q2 fiscal 2025 results show how aggregation can obscure a different problem. The group reported sales growth of 6% while the Urban Outfitters brand’s retail comparable sales fell 9%. Its North American president said the assortment had become too narrow in price, occasion and sensibility. Management said the remedy did not require more total SKUs, but a better representation of the right products.
These are management diagnoses alongside reported results, not audits of the companies’ preseason plans. They illustrate why margin, inventory and option counts need product context. None is a complete test of assortment relevance.
Keep the plan connected while the line changes
Modern assortment planning already addresses option counts, newness, attributes, localisation and, in some systems, item similarity. The useful question is whether those controls remain connected to products while teams are still shaping them.
Financial planning establishes the investment framework. Range planning defines intended product needs and price tiers. Line creation turns those needs into actual products. Regional and channel adoption determine which part of the range each customer will encounter. Forecasting and buy decisions then need to reflect that specific offer.
A product change can preserve the totals and alter the proposition. If the only opening-price trouser is dropped, moving its planned units to a premium style might maintain sales and margin on paper. The revised forecast still needs evidence that customers will trade up.
This is where planning needs an earlier view. Waiting for the final product list means evaluating the consequences after many choices have hardened.
Global planning adds another test. A balanced global range can become a narrow local assortment after regional selections. The products exist somewhere in the business, but not necessarily in the market whose forecast relies on them. Review coverage at the level where the customer will actually shop.
At the next line review, ask:
- Which customer need does each selected product fill, and where are the remaining gaps?
- What changed in price, newness, pairing or delivery since the last review?
- Has each region or channel adopted the products its forecast depends on?
- Which product changes require a revised forecast, another choice or an explicit acceptance of risk?
Keep the approved targets visible during those decisions. Record material assumptions and who will resolve them. Return the adopted products, costs and timing to planning so depth and buy decisions can use the current line. A replacement should explain its customer role as well as its contribution to the totals.
Where VibeIQ fits alongside planning
VibeIQ is where the plan becomes the product line. Merchandising, design and product teams build the actual line and market assortments with commercial targets in view, evaluating the products together as choices evolve.
Planning remains authoritative for financial targets. The adopted line returns to planning for forecasting, depth, allocation and buy decisions, with technical development proceeding through PLM and downstream systems.
A connected workflow cannot guarantee demand. It can give planning a more specific basis for challenging the forecast before commitment. Confidence in the numbers should be traceable to the products expected to deliver them.
Frequently asked questions
Can a preseason financial plan meet its targets while the line underperforms?
Yes. Reconciliation shows that planned figures meet approved targets. The actual products may still lack the coverage or newness needed to generate that demand. Approval confirms that the plan balances; customer response determines whether its assumptions hold.
What is the difference between a financial plan and a product line?
A merchandise financial plan establishes sales, margin, receipts and inventory objectives. The product line is the actual offering intended to deliver them. It determines which products customers can choose, at what prices and when.
How do you know whether a product line is right?
Evaluate breadth, customer coverage, price architecture, pairing, newness and delivery timing against the intended customer. Use product visuals and attributes alongside demand evidence, market feedback and financial constraints.
Why does option count not equal customer coverage?
Option count measures quantity at a defined level, such as style-colour. It does not measure distinct customer needs. Several similar options can fill the count while leaving an occasion, fit or price point uncovered.
Why can historical sales not fully validate a new line?
Sales depend on what was offered and available. Missing products can cause substitution or no purchase. History therefore needs availability context and additional evidence when evaluating new products or unmet needs.
Where does visual line planning fit?
Visual line planning helps teams evaluate the evolving products as a set against range objectives and commercial targets. It makes gaps, duplication, pairing and price architecture easier to assess while choices can still change.