.svg)
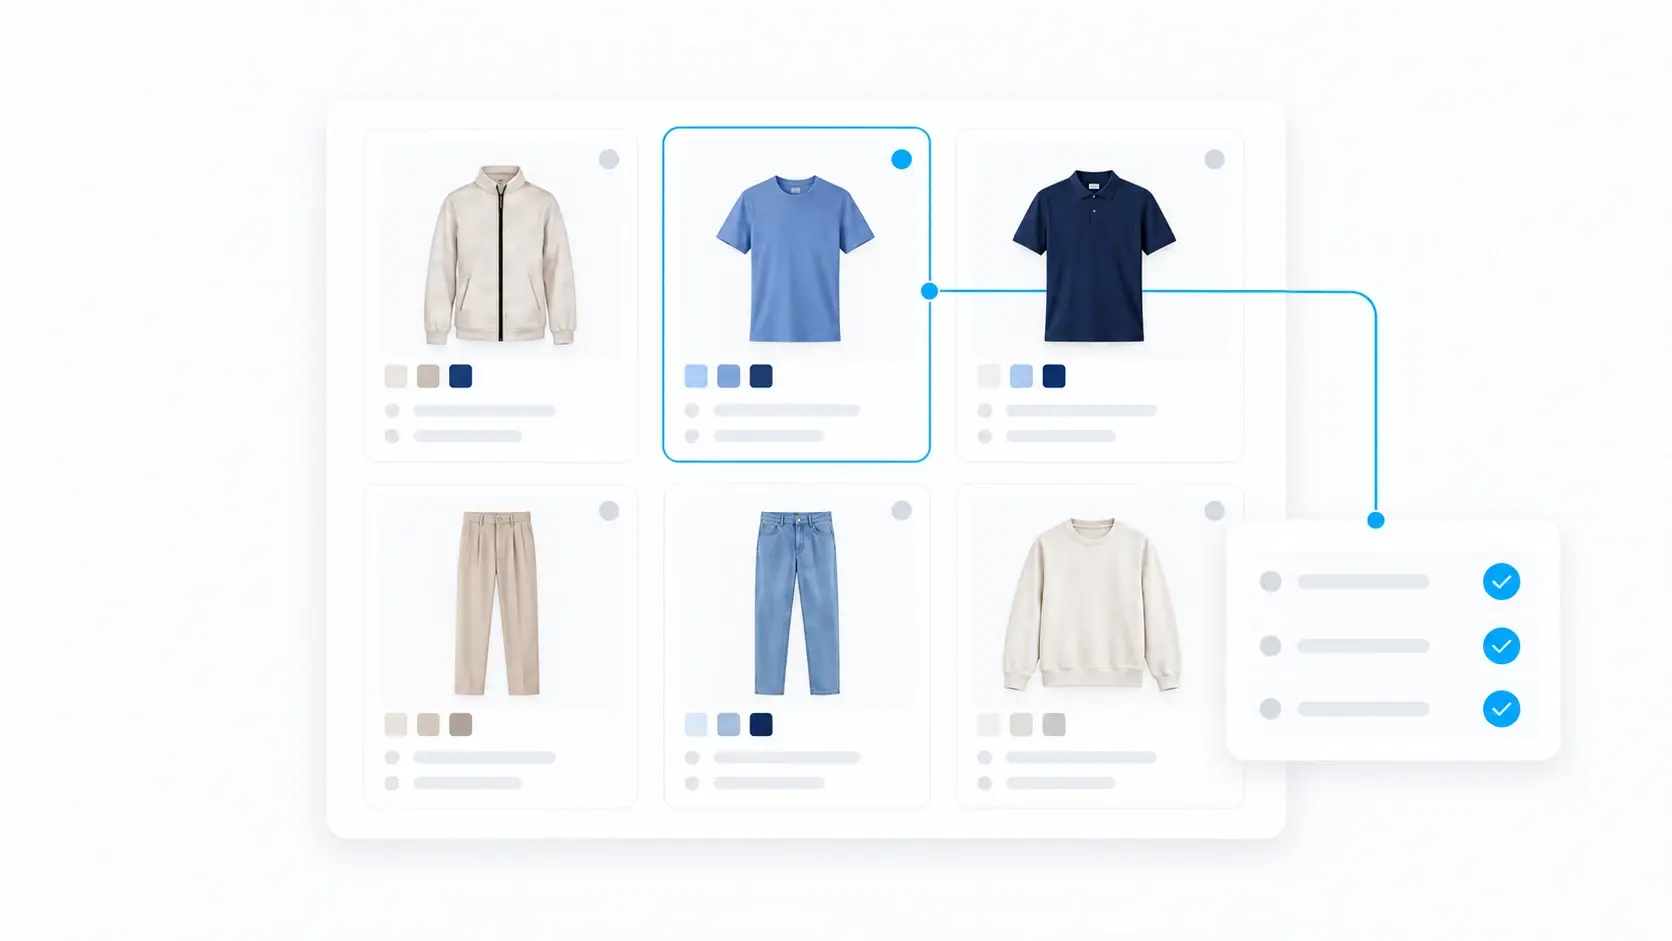
Visual line planning is the process of building and managing a product line in a live visual workspace, where product imagery stays connected to planning data. That data includes SKU counts, margin, lifecycle stage, and assortment performance.
It helps merchandising, design, and product teams decide which products belong in the line and where they should be offered across regions, channels, and accounts.
A connected visual line keeps each product, its data, and the decisions made about it together as the line changes.
How visual line planning differs from spreadsheets and Miro boards
Spreadsheets are useful for calculations, targets, and structured product lists. Teams can track costs, prices, style counts, and delivery dates in rows and columns. But understanding the complete offer also requires seeing the products together: repeated silhouettes, gaps in a color story, or too many similar options at one price point.
Adding thumbnails helps with recognition. It does not, by itself, connect the line plan to the boards, customer assortments, and presentations used by other teams. When those are separate copies, each product change creates reconciliation work.
A Miro board can make a collection easy to discuss visually. The limitation appears when teams use it as a collection of pasted images detached from product records. As one apparel team put it:
“The Miro boards are losing product data and it’s becoming a cut-and-paste visual tool only. I can’t do anything with just the pictures.”
The issue is the connection between the visual and the decision. A picture can show a jacket’s silhouette, but it cannot tell a merchandiser whether its latest cost meets the margin target, whether it has been dropped, or which accounts plan to carry it.
The same team made the requirement explicit: “We can’t use just pictures for critical business decisions like margin impact or SKU counts.”
Visual line planning brings those questions into the workspace where teams review the products. The test is whether a change updates the underlying line and its connected views, rather than leaving someone to copy it into another file.
What good visual line planning includes
A useful visual line plan connects what teams see with the information they need to make decisions.
1. Live product data connected to every visual
Images, sketches, and placeholders link to product records and attributes. Teams can inspect a product’s details without searching for a matching spreadsheet row or guessing which version is current.
2. SKU counts and margin context
Teams can compare the proposed line against commercial targets and see the impact of adding, dropping, or swapping products. Style counts and SKU counts should remain distinct: one footwear model may generate many size, width, and color combinations.
3. Product lifecycle stages
The line shows whether a product is a concept, in development, approved, or dropped. This helps reviewers distinguish proposed options from committed products and identify decisions that still need attention.
4. Assortment and customer views
Teams can organize the same products by region, channel, account, delivery, or category. They can compare local selections while preserving the relationship to the master line, instead of creating unrelated customer decks.
5. Sales performance and feedback
Relevant sales results, carryover performance, and customer feedback sit alongside proposed products. A merchandiser can assess what worked for an account and what that account wants next without separating the commercial evidence from the visual review.
6. Updates across connected views
Changes to shared product information appear in connected plans, boards, and reviews. Updates should respect permissions, approval rules, and intentionally locked versions, so teams know what changes automatically and what requires a decision.
What visual line planning looks like in practice
Consider a footwear team building a seasonal line. Here is how the work connects:
- Build the proposed line. Merchandising sets the intended model count, price tiers, margin targets, and delivery windows. Design contributes concepts, and the team adds placeholders for needs the proposed products do not yet cover.
- Review the balance. Grouping products by price may reveal too many similar models in one tier and no option in another. The team compares those models visually, examines their commercial context, and decides what to retain, change, or drop.
- Shape regional and account assortments. A product may suit one market but not another because of demand, timing, or customer requirements. Those adoption decisions remain connected to the product, so the team can see both the overall offer and where each item is intended to go.
- Keep reviews aligned as decisions change. If a cost changes, the relevant margin context should change with it. If a product is dropped, connected reviews should reflect that decision.
Teams should not have to rediscover a change by comparing a spreadsheet with an old presentation.
How visual line planning works in VibeIQ
VibeIQ is a product decision platform. Visual line planning is its Assort & Adopt decision layer: the work of deciding which products belong in the line and where they should be offered.
- Plan is the live line-planning grid where teams build the line, track targets, manage lifecycle stages, and make assortment decisions.
- Board connects creative work to live products and assortments.
- Showcase supports live line reviews, adoption, presentations, and sell-in.
All three operate from one live product line, so changes flow across connected views without requiring teams to rebuild separate spreadsheets, boards, or presentations.
Frequently asked questions
Who uses visual line planning?
Merchandising and product teams use visual line planning with design, planning, development, and sales. Regional, channel, and account teams contribute adoption decisions and feedback. The process applies to apparel, footwear, and hard consumer goods, although product structures and planning calendars differ by category.
Is visual line planning the same as assortment planning?
The terms overlap, but line planning generally defines the overall product offer, while assortment planning selects the mix for a particular region, channel, store, or account and may include quantities. A connected visual line planning workflow can support both the master line and downstream assortment decisions.
Does visual line planning replace PLM?
Visual line planning and PLM serve different purposes. Product lifecycle management, or PLM, manages detailed product definitions and development information such as specifications, bills of materials, and changes. Visual line planning focuses on selecting and balancing the offer. It can connect to PLM so approved decisions flow into product development.
Is visual line planning the same as visual merchandising?
No. Visual line planning helps teams decide which products to offer and where. Visual merchandising determines how products are presented to shoppers, such as on fixtures, shelves, or a store floor. The processes can inform each other, but they answer different questions.